Why Your ML Models Are Quietly Failing
Picture this: You deploy a machine learning model that predicts customer conversions with 85% accuracy. Six months later, you discover it’s performing at 65% accuracy, and you have no idea when the decline started or what caused it.
This scenario plays out daily across organizations worldwide. Model drift - the phenomenon where model performance degrades over time due to changing data patterns - is one of the most critical yet overlooked challenges in production ML systems.
Today, I’ll walk you through building a complete ML monitoring system that automatically detects drift and triggers retraining on (generated) customer behavioral data. The best part? It runs entirely on your local machine with zero cloud costs.
What We’re Building: A Complete MLOps Pipeline
Our system simulates a real-world customer behavior prediction pipeline with four core components:
The Architecture at a Glance
Customer Data → Drift Detection → Model Retraining → Performance Monitoring
      ↓              ↓                    ↓                    ↓
 [Data Generator] [Drift Detector] [ML Pipeline] [Real-time Dashboard]
What makes this special:
- Zero infrastructure costs - runs on your laptop
- Production-ready patterns - scales to real business scenarios
- Educational focus - learn MLOps concepts hands-on
- Complete automation - detects, alerts, and retrains automatically
Component Deep Dive
1. Customer Behavior Simulator (data_generator.py)
What it does: Creates realistic customer interaction data that gradually evolves over time, simulating real-world business changes.
# Example of gradual drift simulation
drift_multipliers = {
    'age_shift': 1.0 + (drift_intensity * 0.3),     # Aging demographics
    'session_duration_drift': 1.0 - (drift_intensity * 0.4),  # Shorter sessions
    'mobile_adoption': min(0.3 + (drift_intensity * 0.4), 0.9), # Mobile growth
    'purchase_inflation': 1.0 + (drift_intensity * 0.5)  # Rising prices
}
Key Features:
- 5,000 customer pool with returning user behavior
- Realistic relationships between features (age affects purchase behavior)
- Gradual drift introduction over days/weeks
- 50-100 interactions every 30 seconds for real-time simulation
Business Value: Simulates the natural evolution of customer behavior that causes model drift in production systems.
2. Statistical Drift Detector (drift_detector.py)
What it does: Monitors feature distributions and triggers alerts when changes exceed statistical significance thresholds.
# Multi-method drift detection
def detect_numerical_drift(self, feature_name, reference, current):
    # Population Stability Index
    psi_score = self.calculate_psi(reference, current)

    # Kolmogorov-Smirnov test
    ks_stat, ks_p_value = stats.ks_2samp(reference, current)

    # Jensen-Shannon divergence
    js_div = self.jensen_shannon_divergence(reference, current)

    # Conservative approach: drift if ANY method detects it
    drift_detected = psi_score > 0.1 or ks_p_value < 0.05 or js_div > 0.1
Detection Methods:
- PSI (Population Stability Index) - Industry standard for distribution shifts
- Kolmogorov-Smirnov tests - Statistical significance of distribution changes
- Chi-square tests - Categorical feature drift detection
- Jensen-Shannon divergence - Information-theoretic distance measurements
Automated Response: When drift exceeds 5% threshold across multiple features, automatically triggers model retraining with performance validation.
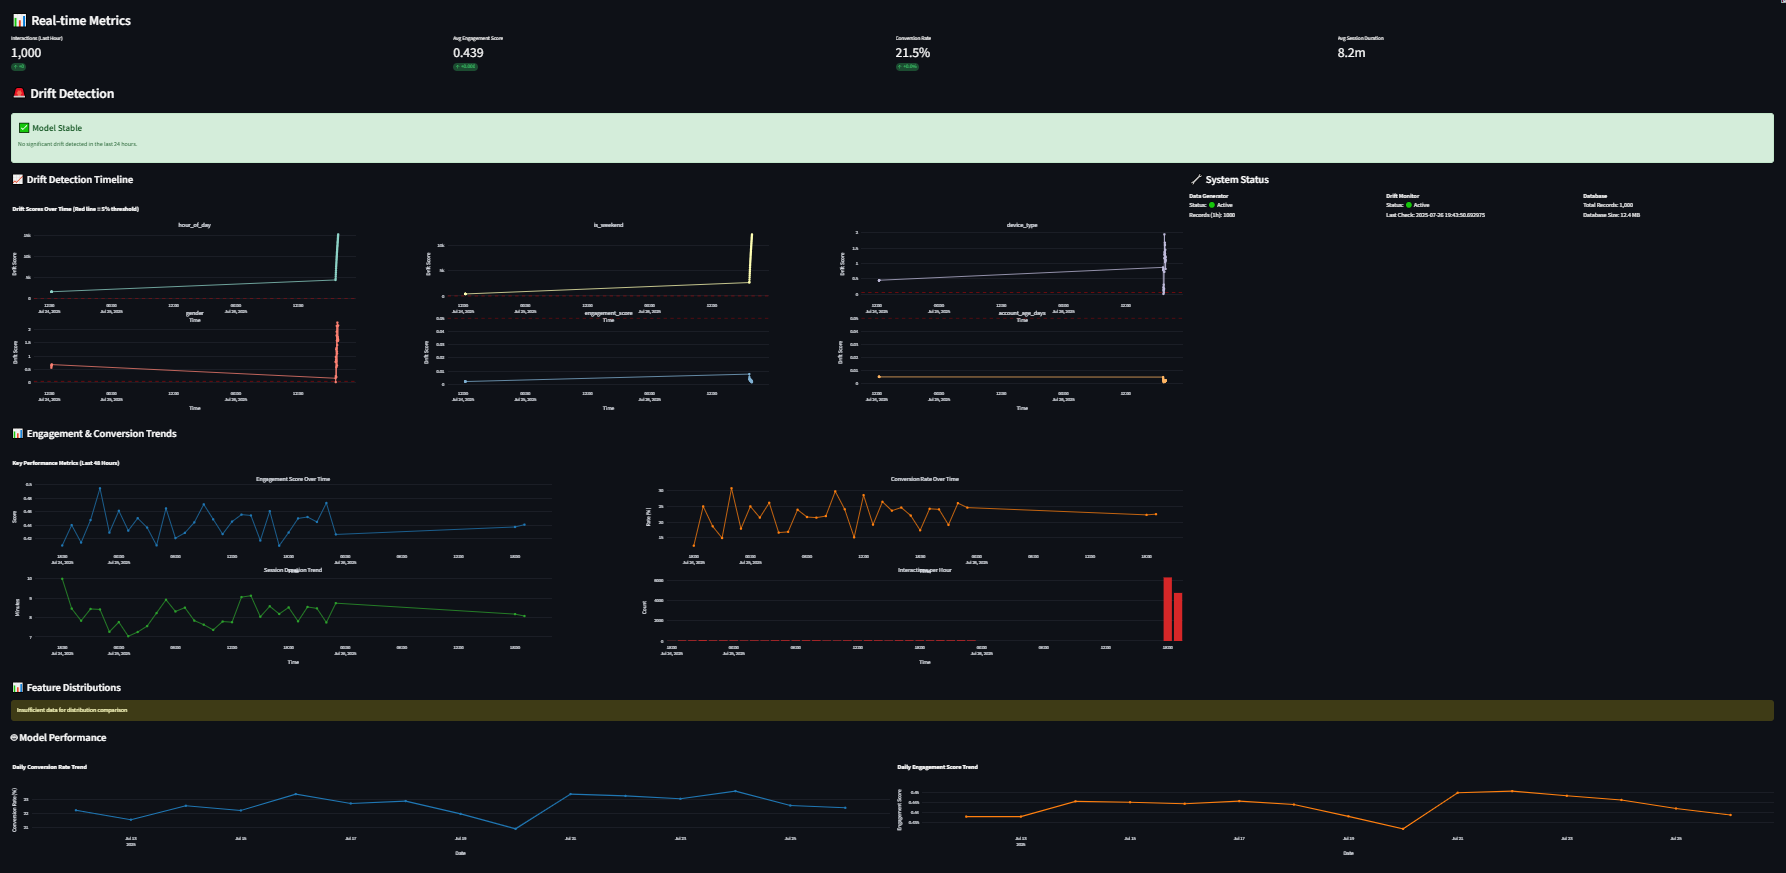
3. Real-Time Dashboard (dashboard.py)
What it does: Provides comprehensive monitoring interface with live metrics, drift alerts, and system health indicators.
Dashboard Features:
- Real-time metrics updating every 30 seconds
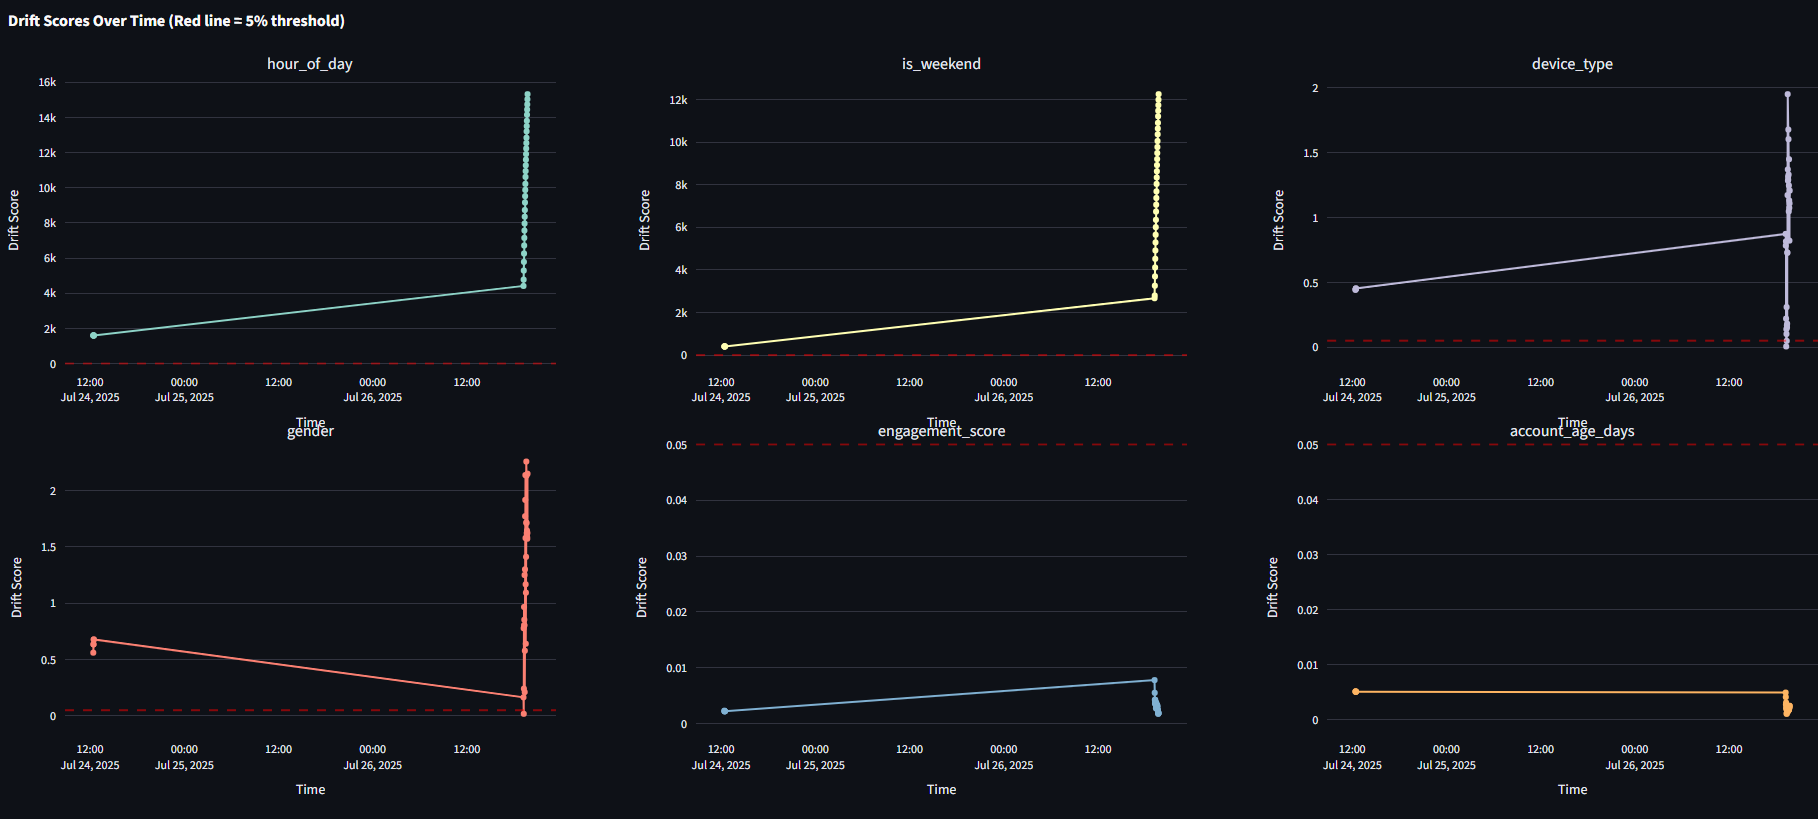
- Drift timeline charts showing feature evolution
- Alert system with color-coded warnings
- Feature distribution comparisons (current vs historical)
- Model performance tracking across versions
- System health monitoring for all components
Technical Implementation:
# Auto-refresh mechanism
if auto_refresh:
    for seconds in range(refresh_rate):
        placeholder.text(f"⏱️ Next refresh in {refresh_rate - seconds} seconds...")
        time.sleep(1)
    st.rerun()
4. System Orchestrator (run_system.sh)
What it does: Manages the complete lifecycle of all system components with production-grade process management.
Management Capabilities:
- One-command startup with dependency installation
- Health monitoring with CPU/memory tracking
- Graceful shutdown with cleanup
- Log aggregation from all components
- Error recovery and restart capabilities
The Complete Data Lifecycle
Phase 1: Baseline Establishment
./run_system.sh start
# Generates 7 days of historical data (3,500 records)
# Establishes statistical baselines for all features
# Trains initial RandomForest model (v1.0)
Phase 2: Real-Time Operation
- Data Generation: 50-100 customer interactions every 30 seconds
- Drift Monitoring: Statistical analysis every 5 minutes
- Dashboard Updates: Live metrics refreshed every 30 seconds
- Performance Tracking: Model accuracy monitoring across time
Phase 3: Drift Detection & Response
# Example drift alert
🚨 Significant drift detected in 3 features!
  - age: 0.087 (threshold: 0.05)
  - session_duration: 0.123 (threshold: 0.05)
  - device_type: 15.234 (threshold: 0.05)

🤖 Starting automated retraining...
✅ New model performs better: 0.863 vs 0.847
🎉 Model updated from v1.0 to v1.1
Key Technical Innovations
1. Multi-Algorithm Drift Detection
Rather than relying on a single statistical test, the system combines multiple methods for robust detection:
- PSI for distribution stability
- KS-tests for continuous variables
- Chi-square for categorical features
- JS-divergence for information-theoretic analysis
2. Conservative Retraining Strategy
# Only deploy if new model improves performance
if new_accuracy > old_accuracy:
    self.model = new_model
    self.model_version = f"v{float(old_version.replace('v', '')) + 0.1:.1f}"
    logger.info(f"🎉 Model updated from {old_version} to {self.model_version}")
else:
    logger.warning("❌ New model performance degraded - keeping existing model")
3. Realistic Drift Simulation
The system doesn’t just add random noise - it simulates realistic business scenarios:
- Demographic shifts (aging customer base)
- Technology adoption (mobile-first trends)
- Economic factors (inflation affecting purchase amounts)
- Behavioral changes (shorter attention spans)
Getting Started in 5-Minutes
# 1. Clone the repository
git clone https://github.com/AkanimohOD19A/rtml-PoC.git
cd ml-monitoring-dashboard

# 2. One-command startup
chmod +x run_system.sh
./run_system.sh start

# 3. Access dashboard
# Open http://localhost:8501
System Requirements:
- Python 3.7+
- 2GB RAM
- 100MB disk space
- Any modern OS (Linux/macOS/Windows)
We obviously did not look through every component for this system, that would take time, however, we can begin to see the how important and useful these kinds of systems are to any data life-cycle endeavor.
Real-World Applications
E-commerce Platforms
- Monitor customer behavior changes
- Detect seasonal shopping pattern shifts
- Track recommendation system performance
Financial Services
- Credit scoring model drift detection
- Fraud detection pattern monitoring
- Risk assessment model validation
Healthcare Analytics
- Patient outcome prediction monitoring
- Treatment effectiveness tracking
- Diagnostic model performance validation
Scaling to Production
When ready to move beyond local development:
Infrastructure Scaling
- Database: Replace SQLite with PostgreSQL/MySQL
- Streaming: Use Apache Kafka for real-time data pipelines
- Deployment: Container orchestration with Kubernetes
- Monitoring: Integrate with Prometheus/Grafana
Advanced Features
- A/B testing frameworks for model comparison
- Feature store integration for consistent feature engineering
- Model registry for version control and rollback capabilities
- Automated CI/CD pipelines for model deployment
Learning Outcomes
By building and experimenting with this system, you’ll gain hands-on experience with:
- Statistical drift detection methods and their trade-offs
- Real-time data processing patterns
- Automated ML pipeline design and implementation
- Production monitoring best practices
- MLOps toolchain integration
Performance Metrics
After running for 24 hours on a standard laptop:
📊 System Performance Stats:
├── Data Generated: 50,000+ customer interactions
├── Drift Checks: 288 statistical analyses
├── Model Retraining: 3-5 automatic updates
├── Dashboard Updates: 2,880 real-time refreshes
├── CPU Usage: <5% average
└── Memory Usage: <500MB total
Conclusion: The Future of ML Monitoring
Model monitoring isn’t just a nice-to-have - it’s a critical requirement for any production ML system. This project demonstrates that sophisticated monitoring doesn’t require complex infrastructure or expensive tools.
The techniques shown here - statistical drift detection, automated retraining, and real-time monitoring - are the foundation of mature MLOps practices used by companies like Netflix, Uber, and Spotify.
What’s Next?
- Experiment with the system locally
- Modify drift parameters to see different scenarios
- Extend with your own features and detection methods
- Scale to your production environment
The complete code is available on GitHub with detailed documentation and examples. Start building more reliable ML systems today!
🔗 GitHub Repository: [https://github.com/AkanimohOD19A/rtml-PoC]